How to Use Tagnovate’s Analytics Dashboard to Understand Customer Behavior
In today’s digital-first world, data isn’t just helpful—it’s essential.
Whether you're using smart business cards, review-collection stands, or in-store NFC tags, it's not enough to just hand out information—you need to know what’s working, what’s not, and what your customers are actually doing after they tap.
That’s where Tagnovate’s Analytics Dashboard comes in.
More than just a tool for NFC activations, it's your command centre for customer behaviour. And if you're serious about growth, loyalty, and ROI, you'll want to dig in.
Here’s a human-friendly breakdown of how to use it—and what kind of goldmine of insights it can reveal.
What Is the Tagnovate Analytics Dashboard?
Let’s start with the basics.
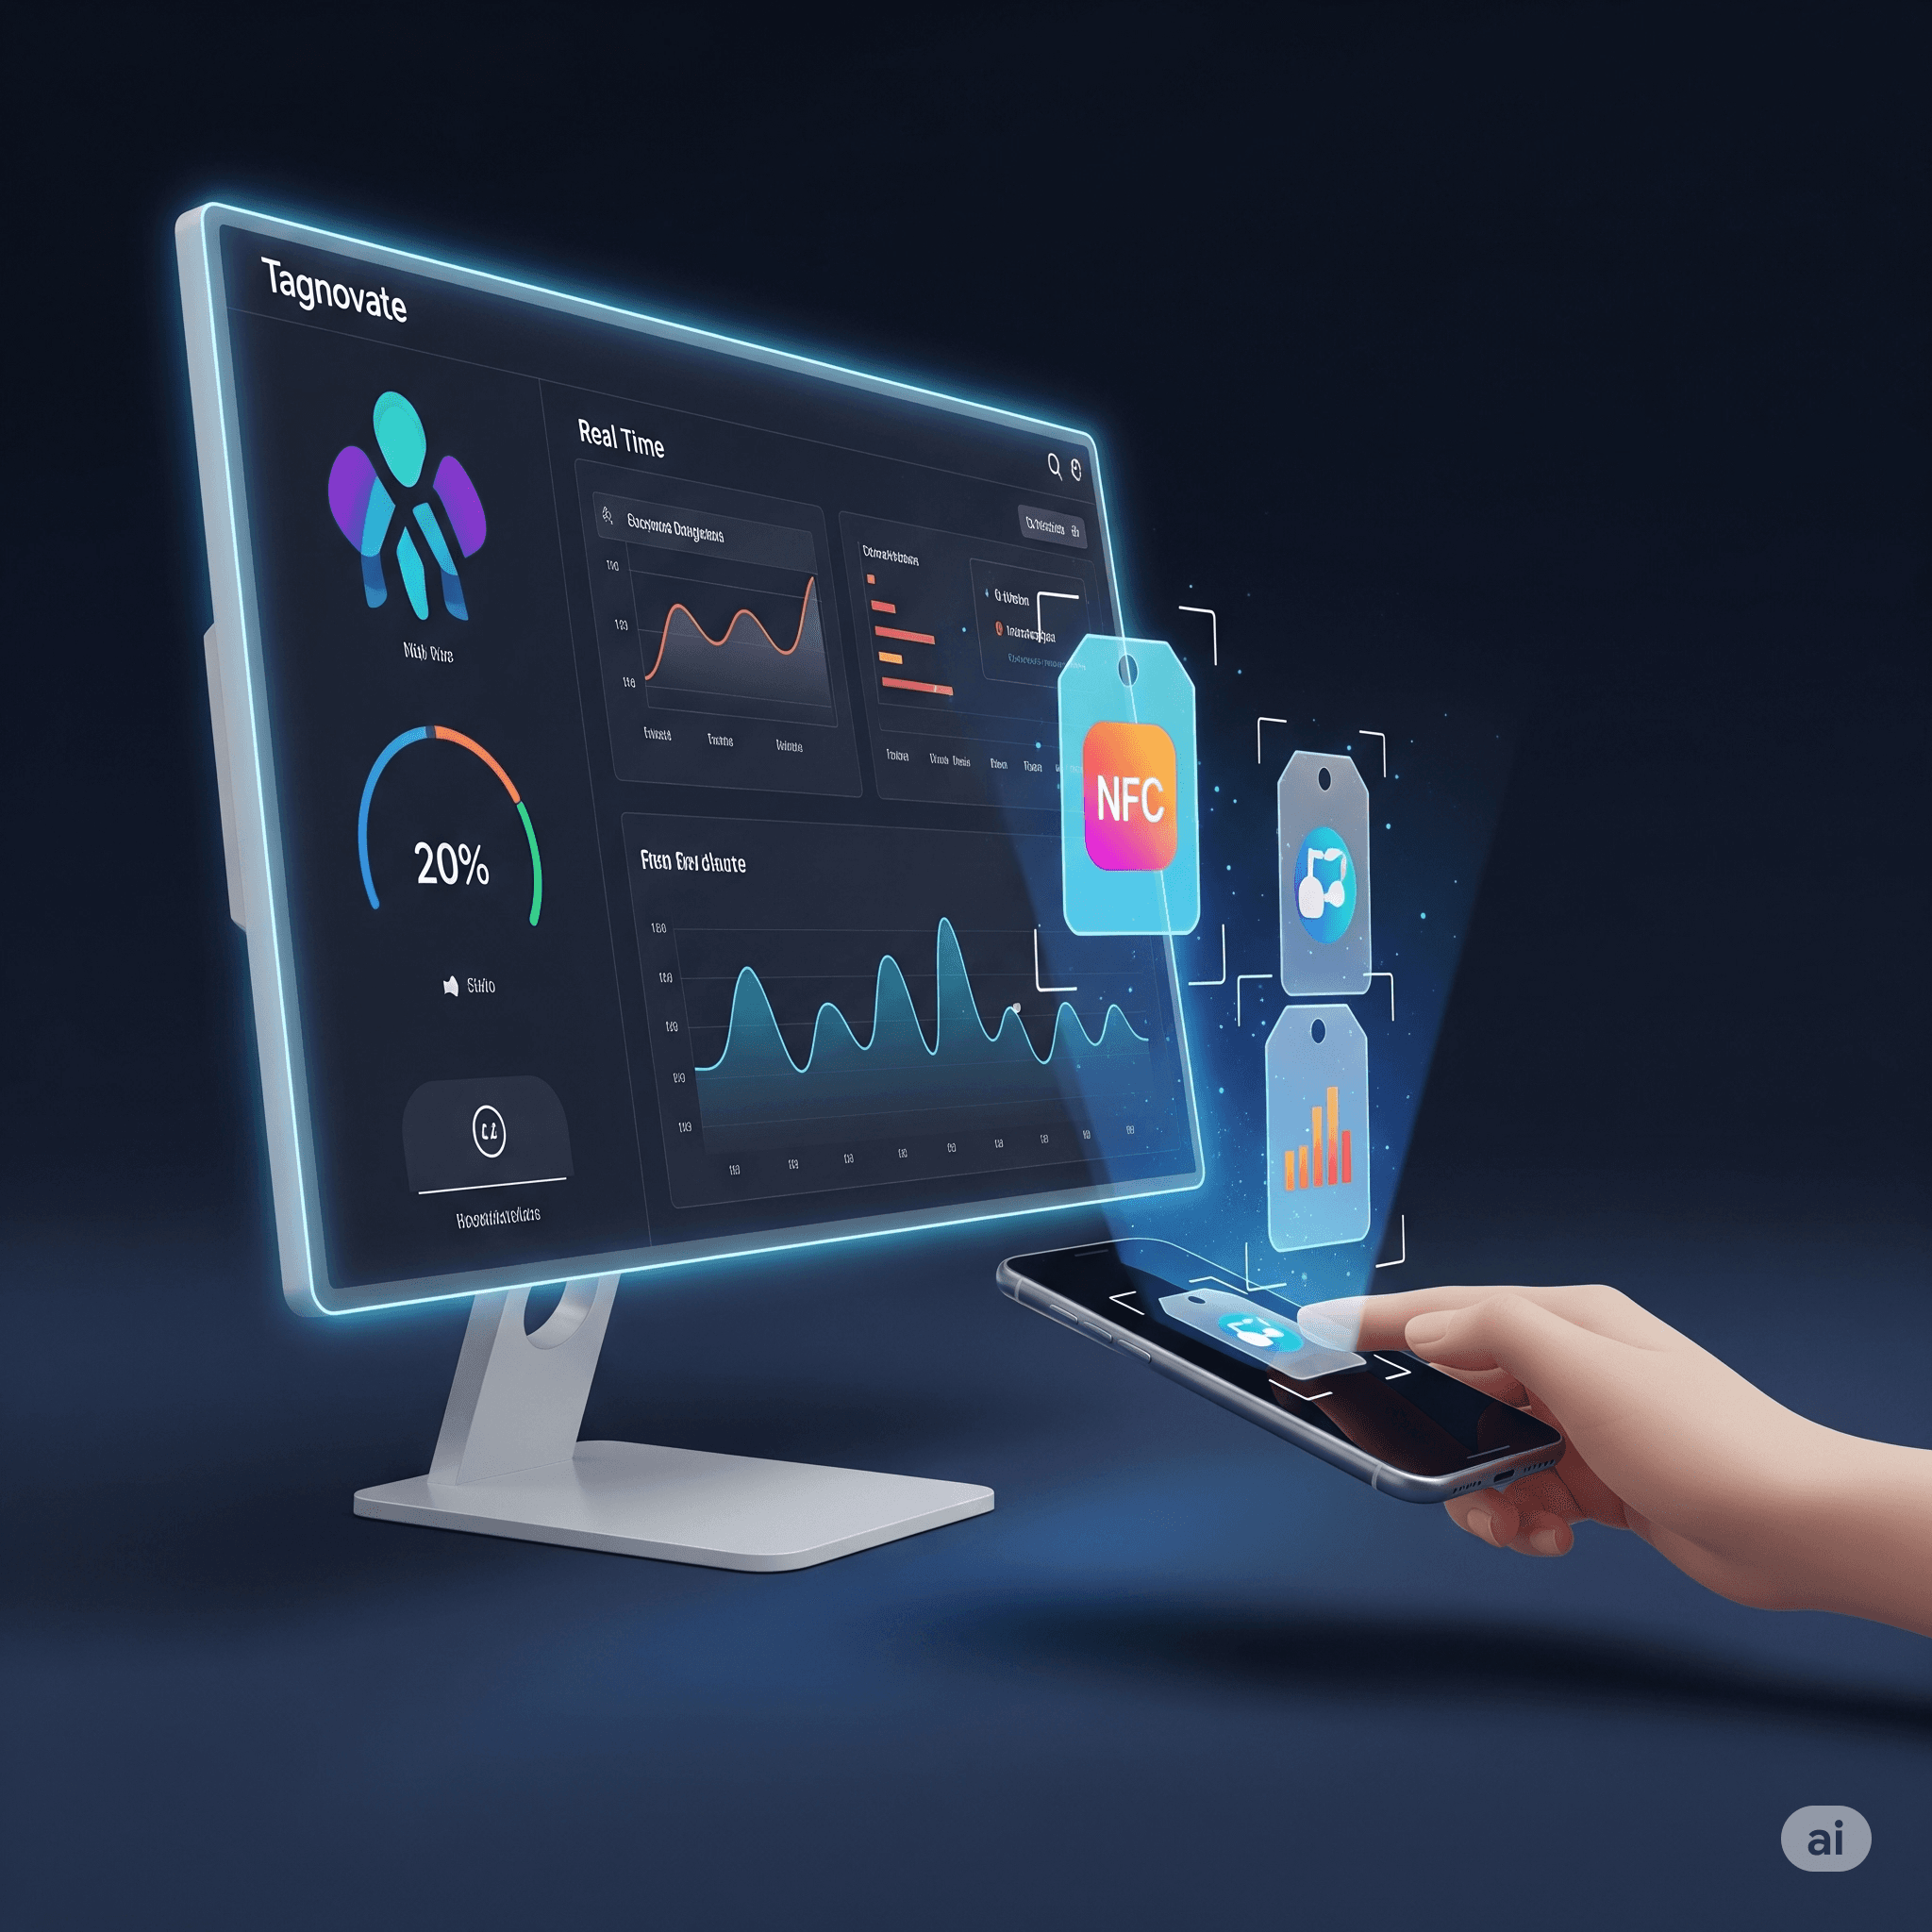
When someone taps your NFC card, stand, or tag, that interaction is captured and sent to your Tagnovate dashboard. The platform tracks key metrics like:
- Number of taps
- Page views
- Button clicks (e.g. “Call,” “Review,” “Follow on Instagram”)
- Geo-location (optional)
- Time of interaction
- Device type (iPhone, Android, etc.)
All this data is displayed in a clean, intuitive interface—no tech degree needed.
Why It Matters: From Guessing to Knowing
Before using analytics, most businesses operate on gut feeling.
“I think this card’s working.”
“People probably visited the site.”
“Maybe they tapped the review stand?”
With Tagnovate, there’s no more guessing. You get real-time, accurate answers like:
- Which location got the most taps this week?
- What time of day are people engaging with your card?
- Are people actually clicking your ‘Review Us’ link or just bouncing?
This helps you do more of what works—and stop wasting time on what doesn’t.
Key Features That Help You Understand Your Customers
Let’s break down what you’ll see—and how to use it effectively.
Tap & Click Volume This is your starting point. You’ll see how many times people have tapped your NFC product and how many have actually engaged with the links/buttons on the landing page. Example: You handed out 100 smart business cards last week. Your dashboard shows 83 taps but only 12 clicks on your "Book a Call" button. That tells you people are interested—but maybe your CTA (Call to Action) needs to be clearer or more compelling.
Location Insights Want to know where your tags are getting the most love? Tagnovate’s dashboard can show you geo-data from user interactions. Great for: It’s like heat-mapping your brand’s NFC hotspots.
- Multi-location businesses (restaurants, salons, gyms)
- Field sales teams using NFC cards in different cities
- Events and expos where location-specific impact matters
Device and Browser Data Understanding what devices your audience uses can help with optimizing your digital content. Are most users on Android? Make sure the Android-specific tap actions are polished. A lot of iPhones? Check how the NFC landing page displays on Safari. This is small stuff with big consequences for user experience.
Top Performing Cards or Tags If you’ve got several Tagnovate products deployed—like a restaurant using table NFC for menus, review stands, and loyalty taps—you can compare which one is performing best. This helps you:
- Identify what’s converting well
- Replace or improve low-performing spots
- Test new offers with real data backing your decisions
Turning Insights into Actions
Data is only powerful if you use it.
Here’s how savvy brands are turning insights into strategies:
- Improving CTAs Low clicks? Try stronger, more actionable language like “Get 10% Off Now” instead of “Learn More.”
- Testing New Offers Run A/B tests using two different NFC cards with different promo messages. See which gets more taps or clicks.
- Replacing Dead Zones Got an NFC table tag that hasn’t seen action in days? Move it. Swap in a different message. Recheck after a week.
- Scheduling Promotions If data shows most interactions happen around lunchtime or after 5 PM, time your social promos or email pushes to align.
How to Access Your Dashboard
Getting started is simple:
Log in at portal.tagnovate.com
Select your NFC product or campaign
View detailed stats and filter by time, location, or tag
Download CSV reports for deeper analysis (if you’re a data geek)
And yes—it’s all part of the Tagnovate SaaS platform, no extra software needed.
Final Thoughts: Smarter Engagement Starts Here
The beauty of NFC tech lies in its simplicity. One tap, and you’re connected.
But what happens after the tap—that’s where the real power is.
With the Tagnovate Analytics Dashboard, you don’t just hand out a card or tag and hope for the best. You learn, adapt, and grow smarter with every interaction.
So whether you’re a solo creative, a retail chain, or a growing hospitality brand—don’t fly blind. Let your data tell the story, and let Tagnovate help you write the next chapter.